

리소스 둘러보기
추천 문서

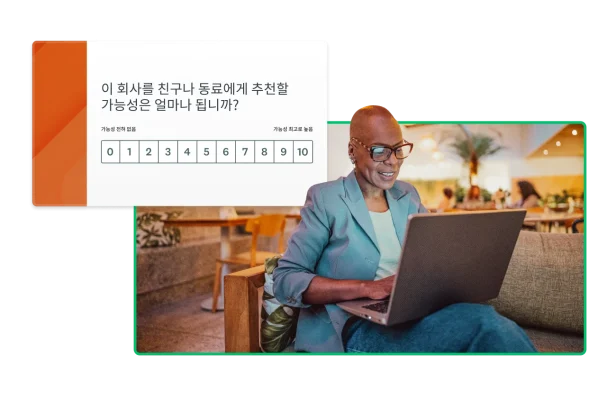
Net Promoter® Score를 정확하게 계산하고 점수를 향상할 수 있는 팁을 알아보세요.

직원들이 행복해 하나요? 효과적인 설문조사 질문을 작성하는 방법을 배워보세요.

팀에게 맞는 회의 시간을 쉽게 조율하는 방법을 알아보세요.

설문조사에 얼마나 많은 응답자가 필요한가요? 최상의 결과를 위해 표본 크기 계산기를 사용하세요.
설문조사 모범 사례

설문조사 모범 사례 및 디자인 가이드라인
전문가처럼 설문조사를 디자인하고, 응답을 수집하며, 데이터를 분석해 보세요.
더 나은 비즈니스 의사결정을 내리기 위해 설문조사를 만들고, 응답을 수집하고, 데이터를 분석하는 방법을 알아보세요.
즉각적인 피드백을 받아 의견을 알아보고 실시간 데이터를 기반으로 결정을 내리세요.
설문조사 편향의 가장 일반적인 유형과 조사에서 이러한 편향을 피할 수 있는 방법을 알아보세요.
의견, 인식 및 행동 양상을 가장 신뢰성 있게 측정하는 방법 중 하나와 이 방법을 다음번 설문조사에 어떻게 사용할 수 있는지에 대해 알아보세요.
일반적인 설문조사 질문을 살펴보고 최상의 결과를 얻기 위해 효과적인 설문조사를 만드는 방법을 배우세요.
고객 피드백

성공적인 고객 피드백 프로그램 구축 방법
피드백을 수집하고 사용해 제품, 서비스, 고객 관계를 개선하는 모범 사례를 알아보세요.
고객 노력 점수를 이용하여 마찰을 줄이고 충성도를 높이는 방법을 알아보세요.
NPS를 계산하고 고객 경험과 만족도를 측정하는 설문조사를 만드는 방법을 배우세요.
NPS의 장점과 한계를 살펴보고, NPS가 고객 충성도를 측정하고 비즈니스 성장을 예측하는 데 널리 사용되는 이유를 알아보세요.
실행 가능한 인사이트를 수집할 수 있도록 더 나은 고객 만족도 설문조사 질문을 작성하는 방법을 알아보세요.
서비스 품질의 5가지 차원을 측정하면 고객을 기쁘게 하고 고객의 경험을 개선할 새로운 방법을 찾는 데 도움이 될 수 있습니다.
시장 조사

시장 조사: 정의, 중요성 및 시작하는 방법
소비자, 감성, 더 넓은 시장에 대해 실행 가능한 인사이트를 제공하는 이 데이터 중심 전략에 대해 알아보세요.
설득력 있는 시장 조사 설문을 만드는 방법을 알아보세요.
2차 조사와 1차 조사의 차이점 및 이를 비즈니스에서 사용해야 하는 이유를 알아보세요.
귀사의 제품과 서비스에 대해 더 나은 의사결정을 내리기 위해 필요한 정보를 얻어보세요.
결과에 통계적 유의성이 있나요? 설문조사 결과에 대한 신뢰도를 보장하기 위해 이 계산기를 사용하세요.
직원 피드백

직원 피드백: 팁, 예시 및 템플릿
올바른 질문을 하는 방법, 탄탄한 직원 피드백 프로그램을 구축하는 방법, 그리고 결과를 활용해 유지율을 높이는 방법을 배우세요.
채용 과정을 개선하고 최고의 지원자를 유치하기 위해 어떤 질문을 해야 할지 알아보세요.
직원 설문조사를 사용해 참여도를 높이고, 직장 문제를 파악하며 조직 문화를 개선하는 방법을 살펴보세요.
트레이닝 설문조사를 통해 트레이닝 프로그램의 효과를 평가하고 개선점을 파악하여 직원을 지원하세요.
명확한 의사소통, 인정, 포용을 통해 건강한 업무 문화를 조성하기 위한 전략을 배우세요.
조직이 더 포용적인 문화를 구축할 수 있도록 설문조사 템플릿과 전문가 지침을 확보하세요.
양식

온라인 양식 만들기
SurveyMonkey를 사용해 쉽게 온라인 양식을 만들고 즉시 응답을 수집하세요.
구조, 질문 유형, 사용자 경험에 대한 모범 사례를 포함하여 효과적인 온라인 양식 설계에 대한 안내를 받으세요.
맞춤화와 작성이 쉬운 온라인 등록 양식을 만드세요. 필요에 맞는 다양한 템플릿 중에서 선택하세요.
고객이나 다른 사람들로부터 직접 피드백을 수집하여 비즈니스, 제품, 브랜드를 개선하세요.
RSVP 양식을 작성하는 팁을 얻고, 게스트 응답을 수집 및 추적하여 이벤트 참석을 효율적으로 관리하는 방법을 배우세요.
임베드할 수 있는 양식으로 응답률을 높이고, 연락처 정보를 포착하며 등록 및 신청 절차를 간소화하세요.
조사 및 분석

설문조사 데이터 분석 방법: 방법 및 사례
설문조사 데이터를 효과적으로 분석하고 쉽게 더 나은 설문조사를 만드는 방법에 대해 알아보세요.
올바른 정보와 도구를 사용하여 전문가가 아니어도 설문조사 데이터를 통계적 방법으로 분석할 수 있습니다.
탐색적 조사에 대해 심층적으로 알아보고 이를 조사 활동에 구현하는 네 가지 방법을 배우세요.
원인과 결과의 관계를 이해하고 가설을 테스트하고 결과를 검토하여 정보에 입각한 결정을 내리세요.
회사 설문조사를 향상시키기 위한 정량적 연구 활용 팁을 확인하세요.
오차 한계를 계산하는 방법을 배우고 온라인 계산기를 사용해 즉시 측정하세요.
제품 개발

거의 실시간에 가까운 피드백으로 더 나은 제품을 더 빠르게 만드는 방법
제품 개발 과정 전반에 걸쳐 설문조사를 사용해 고객 피드백을 수집하고 요구사항을 파악하며 제품 개선을 위한 정보를 수집하는 방법을 알아보세요.
아이디어 선별이 조사 및 분석을 뒷받침하는 성공적인 제품을 보장하는 데 어떻게 도움이 되는지 알아보세요.
고객의 지불 의사를 평가하여 가격 전략과 시장 수요에 대한 인사이트를 확보할 수 있습니다.
출시 전후로 인사이트를 수집해 제품과 고객 만족도를 향상시키세요.
신뢰할 수 있는 대상자로부터 제품 아이디어와 개념을 1시간 이내로 검증하세요.
다음 광고 캠페인, 제품 출시 등을 개선하기 위해 콘셉트 테스트 설문조사를 계획, 설계, 발송, 분석하는 방법을 알아보세요.
이벤트 관리

이벤트 피드백 관리: 이벤트 전 및 이벤트 후 설문조사
다음 이벤트를 시작부터 끝까지 성공적으로 만들기 위한 팁과 템플릿을 받으세요.
이벤트의 모든 단계에서 귀중한 피드백을 수집하기 위해 어떤 설문조사 질문을 할지 알아보세요.
이벤트 계획에 맞춤화하여 사전 제작된 설문조사 템플릿으로 참석자 선호도와 기대치를 수집하세요.
설문조사를 통해 참석자들로부터 피드백을 수집하여 더 성공적인 이벤트를 주최하세요.
다음 기업 행사나 파티를 개선할 실행 가능한 인사이트를 수집하기 위한 전문가 팁.
준비와 체계적 관리, 그리고 SurveyMonkey 도구를 통해 이벤트를 원활하게 진행하세요.
마케팅

마케팅 설문조사: 질문 샘플과 예제 등
마케팅 설문조사를 단 몇 분 안에 만들고 필요한 데이터를 확보하여 고객 만족도, 제품, 가격, 크리에이티브 캠페인 등을 향상시키세요.
스마트하고 전략적인 비즈니스 의사결정을 위한 시장 인사이트 개발
질문 브레인스토밍부터 결과 분석까지 광고 테스트를 수행하는 모범 사례를 알아보고 최상의 옵션을 찾으세요.
브랜드 성과를 추적하고 시간이 지나며 어떻게 발전하는지 확인하세요.
독창적인 조사로 콘텐츠 마케팅을 위한 설득력 있는 데이터를 얻는 방법을 알아보세요.
업계 전문가들이 AI를 마케팅에 활용하는 방법과 AI 사용도에 대한 SurveyMonkey의 조사 통계를 심도있게 확인하세요.
교육 설문조사

학교, 교사 및 학생용 교육 설문조사
SurveyMonkey는 미국 교육부 및 Harvard 교육대학원과 협력해 교육 개선을 위한 설문조사 템플릿을 설계했습니다.
학생, 교사, 학부모에게 설문조사를 보내 학교 또는 대학의 성과 등 여러 가지 사항을 파악하세요.
학생의 요구, 선호도, 어려움을 이해하여 보다 효과적인 교육 환경을 조성하세요.
학생 설문조사 질문으로 교수법을 개선하세요. 수업, 활동 등에 대한 솔직한 피드백을 받아 더 나은 학습 환경을 만드세요.
SurveyMonkey와 Harvard 교육대학원의 초·중등 학부모 설문조사 템플릿을 사용해 학부모 참여도를 개선하세요.
학술 연구에 설문조사를 통해 얻은 데이터와 인사이트를 더하세요.
보건의료 설문조사

보건의료 설문조사: 질문 및 템플릿
보건의료 설문조사를 이용하여 환자 피드백을 수집하고, 의료 서비스 품질을 개선하며, 의료 시설의 의사 결정을 지원하세요.
환자 만족도 설문조사로 보건의료 경험을 평가하고 환자 관리 개선을 추진하세요.
이 설문조사 템플릿을 이용하여 의료 기관 내 환자 안전 문화를 평가하고 개선하세요.
임상 연구, 환자 결과 및 보건의료 발전을 위한 중요한 데이터를 수집하는 데 설문조사를 활용하는 방법을 알아보세요.
SurveyMonkey가 어떻게 고객의 HIPAA 준수 요구를 지원하는지 알아보세요.
샘플 평가 질문과 건강관리 설문지 예제를 받아보고, 전문가처럼 건강관리 설문조사 질문을 작성하는 방법을 알아보세요.
Net Promoter, Net Promoter Score 및 NPS는 Satmetrix Systems, Inc., Bain & Company, Inc. 및 Fred Reichheld의 상표입니다.

