제품

SurveyMonkey는 모든 사용 사례와 요구를 다루도록 구축되었습니다. 제품을 둘러보고 SurveyMonkey로 어떤 효과를 누릴 수 있는지 알아보세요.

온라인 설문조사의 글로벌 리더로부터 데이터 기반 인사이트를 얻으세요.

하나의 강력한 플랫폼에 있는 핵심 기능과 고급 도구를 살펴보세요.

정보 수집과 결제를 위한 온라인 양식을 만들고 맞춤화하세요.

100개 이상의 앱 및 플러그인과 연동하여 업무 효율성 향상

시장 조사에 필요한 모든 것을 갖춘 솔루션

빌트인 AI을 통한 더 나은 설문조사 작성과 빠른 인사이트 발견

템플릿

비즈니스에 대한 고객 만족도와 충성도를 측정

고객을 만족시켜 지지자로 만드는 것이 무엇인지 파악

실행 가능한 인사이트를 얻어 사용자 경험을 개선

잠재 고객, 참석자 등으로부터 연락처 정보를 수집

다음 이벤트를 위해 쉽게 RSVP를 받고 확인

다음 이벤트의 개선을 위해 참석자가 무엇을 원하는지 파악

참여도를 높이고 더 나은 결과를 이끌어낼 인사이트를 발견

참석자들의 피드백을 받아 회의 운영 방법을 개선

동료 피드백을 통한 직원 성과 향상

더 나은 코스를 만들고 교수법을 개선

학생들이 코스 자료 및 프레젠테이션을 어떻게 평가하는지 파악

신제품 아이디어에 대한 고객의 생각을 파악

리소스

설문조사 및 설문조사 데이터 사용에 대한 모범 사례

설문조사, 비즈니스를 위한 팁 등에 관한 블로그

SurveyMonkey 이용에 대한 튜토리얼 및 사용법 가이드

최고의 브랜드들이 SurveyMonkey로 성장을 견인하는 방법

영업팀에 문의로그인
영업팀에 문의로그인

Results Dashboard

Easily create and share dynamic survey dashboards with real-time results.

Dashboard results on computer monitor

Transform your survey results into a report your stakeholders will understand. With survey dashboards, you can highlight key takeaways and even add in your own notes or recommended next steps. You can create multiple dashboards for any single survey. Plus, your dashboards dynamically stay up-to-date and can be shared with anyone via a weblink.

By creating survey dashboards, you can easily surface the most important details for specific groups. Help your stakeholders see where and how to take action on your survey results.

Whether it’s for your boss, colleagues, or clients, easily personalize how you share results. Filter answer data, select which questions to show, drag-and-drop charts, and customize your layout.

Show your stakeholders only the information they want or need to see. Data will dynamically refresh as new results come in, so you don’t need to spend time updating static reports and presentations.

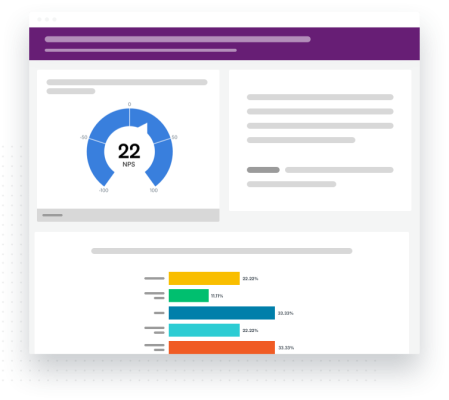
NPS dashboard

Want to monitor your Net Promoter Score®, identify its key drivers, and easily keep everyone informed along the way?

With Results Dashboards, you can:

  • Filter data by month or week, and then show charts side-by-side to easily compare scores over time
  • Add comments below or next to individual charts to flag changes or provide more context
  • Display what delights your customers and what drives their dissatisfaction
  • Customize charts and colors to personalize your dashboards
  • Share your recommendations—all backed up by data—with executives, managers, or even your own team

Only want to share some key findings with specific groups? Here’s how you could run a quarterly employee engagement survey across an organization and give each team actionable insights.

With Results Dashboards, you can:

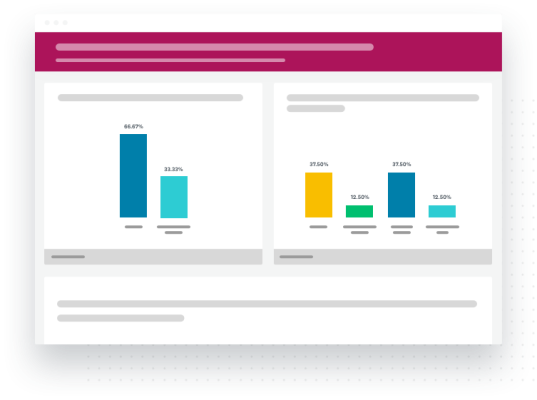
  • Filter data by department, team, or business unit, and create individual dashboards for any group
  • Show stakeholders key points by including data on things like key attributes, such as job satisfaction
  • Tailor the look and feel of your dashboards with custom colors
  • Show how teams or departments compare to overall averages
  • Do a side-by-side comparison of results from different time periods to see trends and changes
Employee dashboard

Woman with red hair creating a survey on laptop

역할 또는 업계에서 피드백을 활용할 수 있도록 돕기 위해 디자인한 도구 키트를 살펴보세요.

A man and woman looking at an article on their laptop, and writing information on sticky notes

퇴사자 인터뷰 설문조사에서 올바른 질문을 하여 직원 감소율을 낮추세요. 직원 양식 작성기 도구와 템플릿으로 지금 시작하세요.

Smiling man with glasses using a laptop

맞춤 동의서 양식으로 필요한 허가를 받으세요. 지금 무료로 가입하여 동의서 양식 템플릿으로 간편하게 양식을 만드세요.

Woman reviewing information on her laptop

요청 양식을 수월하게 만들고 맞춤화하여 직원, 고객 등으로부터 요청을 받으세요. SurveyMonkey의 전문가가 작성한 템플릿으로 단 몇 분만에 시작할 수 있습니다.