Are you building an inclusive workplace?
Measure what drives inclusion at your company with our expert-designed survey template.
Diversity is about more than demographics
No matter how much you focus on hiring a diverse workforce, you’re not actually moving the needle if your employees don’t feel a sense of belonging. For diversity and inclusion efforts to succeed, it’s important to look beyond demographics, using data to uncover what makes a culture truly inclusive. The data you gather can be a guide for creating an environment of inclusiveness in the workplace where all employees can thrive.
Trying to build a D&I program that supports all your employees? Our end-to-end guide includes free templates and expert advice for building an inclusive company culture.
Understand what drives inclusion
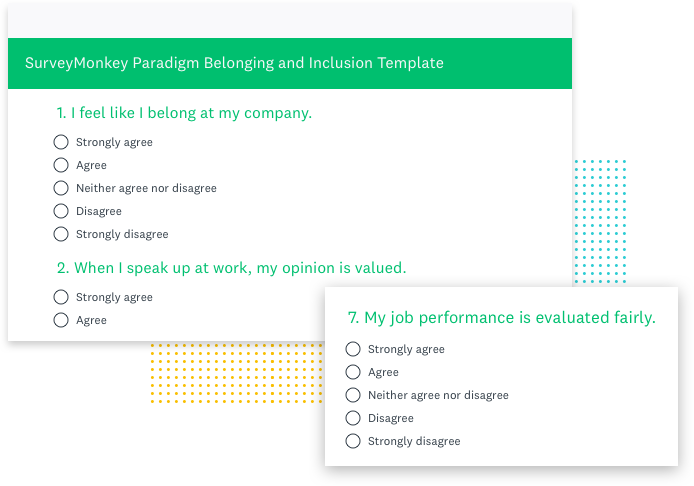
We’ve created a survey template that focuses on three key components of inclusion, each based on research by Stanford University experts Carol Dweck, Greg Walton, and Geoffrey Cohen.
- Growth Mindset: Does your company have a “Culture of Genius” that suggests talent, abilities, and intelligence are fixed traits? This can hinder feelings of belonging and growth, especially for people from underrepresented groups.
- Belonging: Feeling that you don’t belong can be incredibly taxing and is often related to social identity. How do different groups experience belonging at your company?
- Objectivity: Is there a perception in your organization that advancement isn’t based on fair and transparent criteria?
Designed by experts, backed by science
Our survey was designed in partnership with Paradigm, a leader in diversity and inclusion strategy, to help companies take a data-driven approach to measuring inclusion that draws on behavioral science.
- Vetted by survey experts: Tested with a diverse audience to comprehensively address inclusion and provide accessibility for all groups.
- Track record of success: Based on concepts proven to positively affect student wellbeing and success in school. Translated to meet requirements for the workplace.
- Measurable impact: Fight employee attrition. Our tests show a relationship between the answers to these questions and stated likelihood to stay in their job.

리소스 더 살펴보기

데이터 기반 인사이트로 최고의 인재를 유치하고, 참여를 높이며, 이탈을 방지하세요
SurveyMonkey로 강력한 HR 설문조사를 만들어 피드백을 수집하고, 참여도를 높이며, 직장 문화를 개선하세요. 맞춤화할 수 있는 템플릿으로 HR 프로세스를 간소화하세요.

우수한 직원 참여도 프로그램 구축 방법
직원 유지율을 높이고 비즈니스 성과를 입증할 수 있는 직원 참여 전략을 구축하세요. 매니저에게 권환을 부여하고 직원 피드백을 업무 환경 개선으로 전환하는 실행 계획을 수립하세요.

학습 프로그램으로 직원들의 성공을 지원하세요
강력한 설문조사 소프트웨어로 L&D의 영향을 평가하세요. 피드백을 수집하고, 성장을 추적하며, 장기적인 성공을 지원하는 인사이트로 직원 개발 활동을 개선하세요.

포용성 및 소속감 설문조사 소프트웨어
설문조사 소프트웨어로 더욱 포용적인 직장 환경을 촉진하세요. 소속감을 평가하고, 솔직한 피드백을 수집하며, 모든 의견이 존중되는 문화를 구축하세요.
Get an end-to-end engagement solution
Build and retain a happy, healthy, effective workforce with SurveyMonkey Engage.