What is customer experience (CX)? And how can you measure and improve it?
Customers may have hundreds of interactions with your company over the course of your relationship, where each one represents an individual data point on how they feel about your products, services, and more. Measuring these data points over a customer’s life cycle is challenging by itself. It becomes exponentially more complex when you scale it across the hundreds, thousands—or more—people who make up your customer base.
Yet this holistic understanding of how your customers feel about your organization defines customer experience (CX) and is key to driving loyalty, growth, and revenue for companies around the world. Customer experience is how customers perceive your organization as a result of all the contact they have with your team and your products—from when your relationship starts to when they stop working with you.
Measuring and tracking customer experience is essential to helping your organization achieve success, but doing so requires a thoughtful process. You’ll need to collect the right types of feedback and analyze them comprehensively, quickly, and collaboratively.
We’ll show you how, and we’ll provide the resources you need to start measuring customer experience. To start, we’ll talk about why CX is so important, but if you’re eager to skip ahead to a specific section, you can click-through the following table of contents!
Why customer experience matters
There’s a seemingly endless number of statistics that validate the importance of CX. For example:
- Bain found that companies who provide a first-class customer experience earn anywhere from 4 to 8% more revenue than other organizations in their market.
- According to a study done by Forrester Consulting, companies that prioritize the customer experience have a 70% higher customer retention rate.
- Through our own research, we’ve found that 88% of customers who receive a poor experience lose trust in that brand, while 57% of people have permanently stopped using a product after one bad experience.
- We’ve also discovered that 49% of customers recommend a brand to friends or family members without being prompted.
Unfortunately, organizations by and large fail to live up to customer’s standards. According to research by Bain & Company, 4 out of 5 CEOs think they provide customers with superior experiences, but only 8% of those customers agree.
To give clients what they’re looking for, you have to get systematic. You’ll need to continuously collect feedback from every customer, analyze their responses, and share them out across the team so they can take action.
Let’s begin our step-by-step walkthrough of this framework by reviewing the different ways you can assess customer sentiment.
How to measure customer experience
To measure customer experience successfully, you’ll need to be thoughtful about how you collect feedback as well as what you ask. There are several ways that companies measure customer experience, each with their own set of pros and cons.
Methods for measuring customer experience
1. Run customer surveys. Surveys are probably the most common method for measuring customer experience, and it’s not hard to see why. Since you can use one questionnaire to gather thousands of responses, you can make short work of measuring even the largest groups of customers.
Pros:
- They’re cost-effective. The cost of sending a survey to your customer base is exponentially cheaper than the other, more resource-consuming options.
- They’re scalable. Surveys give you the power to interview huge portions of your customer base—or even all of them!
- They’re actionable. The responses are collected and organized in a way that’s straightforward to interpret and make decisions from.
- They’re trackable. You can easily see how your responses are changing over time.
They’re automated. With a sophisticated survey solution, like SurveyMonkey CX, you can set parameters that trigger your survey’s delivery (e.g. once a customer finishes onboarding).
Cons:
- It’s hard to go in-depth. You need to cap your survey at a certain number of questions to prevent respondents from either leaving your survey early or answering its questions inattentively.
Data collection can be a touchy subject. Explicitly mention that your survey is anonymous. Otherwise, customers might think their responses can be traced back to them, which can make them uncomfortable in providing candid feedback.
2. Interview individual customers. If you want to get detailed, in-depth feedback from the people you rely on for your business, there’s no better way than to talk to them directly. It may seem time consuming, but direct contact with customers can be well worth it.
Pros:
- It’s comprehensive. You can ask them as many questions as you want (within reason) about whatever you want, to get in-depth feedback about your customers needs and pains.
- It builds rapport. A face-to-face interaction with a customer helps them become more familiar with you and your organization, which likely increases their loyalty to your brand.
Cons:
- It’s costly. It can take up a lot of resources (in both time and money spent) to schedule and hold interviews with customers.
- It involves just a sample of your customers. You probably won’t be able to interview a representative sample of customers, but instead receive feedback from a small set of individuals who voice their opinions the loudest. As a result, there’s a chance that your product roadmap and strategy can be steered in the wrong direction.
- It can be difficult to manage. In most cases, maintaining a customer-interview program is a full-time job, which means you’ll need dedicated resources to make it work.
3. Conduct focus groups. Focus group discussions tend to be more free-form than surveys or direct interviews, which are usually scripted. You don’t even have to get everyone in the same room to have a focus group—you can hold the meetings over video conference or on the phone.

Pros:
- It allows customers to learn from each other. The chance to hear how others work with you can inspire customers to use your product/service in new ways.
- It can promote dynamic and engaging conversations. With a variety of different perspectives, the conversations can take unexpected and insightful turns.
Cons:
- It’s expensive. Organizing and facilitating it can come at a high cost.
- Talk-time isn’t equally shared. Certain customers may be more eager to speak than others, preventing those who feel more reserved from offering their thoughts and opinions.
It can encourage groupthink. Participants may feel inclined to agree with each other, even when they feel differently.
Deciding how often to collect feedback—and when—depends on the method you choose. Aim to send your survey every 3-6 months, interview customers a few times per year, and hold focus groups for specific purposes, irrespective of time.
No matter how you plan to collect feedback, there are certain questions you’ll want to ask. Let’s review what they are.
Note: These approaches to collecting feedback should complement your analysis of financial data points. These include your churn rate (the rate that customers stop using your product or service after a given period of time) and your average customer lifetime value (the expected profit you’ll receive from a customer over the course of your relationship with them.).
What are the best customer experience metrics to measure?
1. Net Promoter Score® (NPS): The most widely used customer experience metric is the Net Promoter Score. From understanding the likelihood that customers will churn to the chance they’re willing to buy additional products or services, no metric is better for understanding the likelihood that your customers stick around and buy more from you in the future.
The NPS can be used to measure the customer experience at specific time-based intervals (“Relational NPS”) or following a defined set of customer experiences (“Transactional NPS”), like after a customer makes a purchase or speaks to a service representative.
The NPS comes from the question, “How likely is it that you would recommend this company to a friend or colleague?” But it’s often also applied to products, services, or interactions with companies. Respondents are asked to select a rating from 0 (lowest) to 10 (highest), and once the responses come back, it applies a formula that results in a Net Promoter Score, which can range from -100 to +100.
Pro tip: If you use the NPS question in our Question Bank, SurveyMonkey will automatically calculate your score once the responses come back.
We consider the NPS question essential to ask, but here are some additional customer experience metrics worth considering:
Run a first-class NPS survey program with SurveyMonkey CX
Embed a branded NPS question in your email, automate its delivery, and more with CX.
2. Customer effort score (CES): Customer effort score measures how much effort the customer needs to exert in order to solve issues with your product or service. The idea is that the less friction customers experience with your product or service, the more likely they are to stay on and increase their level of spending. In general, the customer effort score is used to evaluate specific types of experiences in the customer journey (otherwise referred to as “transactional touchpoints”).
To evaluate your customer effort score, you can simply ask, “[Your company] made it easy for me to handle my issue.” with the answer choices ranging from strongly agree to strongly disagree. You can then assign numerical values to each choice. For instance, “Strongly agree” can be a 1, “Agree” can be a 2, “Neither agree nor disagree” can be a 3, and so on. You’d then calculate the average score from all of your answers, where a higher average rating reflects a higher level of effort for customers.
Learn more about using the customer effort score.
3. Customer satisfaction (CSAT) score: The CSAT score is designed to measure customers’ overall sentiment of something, like a product, company or service. Instead of focusing on a specific element of the customer experience, like loyalty or effort, it attempts to get a holistic read of customers’ feelings about an issue. The most common way to ask about general customer satisfaction in a survey is to ask, “How would you rate your experience with our (fill in the blank)?” with the answer choices ranging from very satisfied to very dissatisfied.
To get your CSAT score, take the number of satisfied customers (those who selected “very satisfied” and “satisfied”) and divide it by the total number of respondents. Then, multiply the fraction by 100 to give you a percentage—where a higher percentage means that, all else equal, you have more satisfied customers!
How to analyze customer experience data
One of the best things about running customer surveys is that the feedback you receive is easy to analyze, understand, and act on. Since it comes in the form of survey data, it’s simple to quantify and measure your results and spot patterns that can inform how to improve customer experience.
Review your survey results effectively by following these 4 steps:

Review the data at a high level
Using SurveyMonkey Analyze, take a look at the responses from each of your closed-ended questions (prompts that ask respondents to select an answer from a predefined set of choices).
If you asked the NPS question from our Question Bank or from one of our pre-built templates, SurveyMonkey will automatically calculate your score.

You can check to see how it compares to other companies in your industry, company size, or area by using SurveyMonkey Benchmarks. Simply click on the bar chart icon (above and to the left of the NPS score visual) to access them.
For each of your other closed-ended questions, build customizable charts. They can help you identify the key takeaways from your results, quickly.
Read more about the different types of charts you can use and how to make the most of them!
Dive into the data with filters and compare rules
After you understand the general sentiment of your customers, look deeper to find out how the individual groups that make it up feel.
Filter your results by Detractors, Passives, and Promoters to see how each group answered the rest of your questions.
Note: If you're interested in finding out exactly what factors are having the biggest impact on your NPS, try SurveyMonkey CX. The turn-key NPS solution offers a Key Drivers feature, which lets you identify strengths and weaknesses and correlate them to your score, so you know what to focus on to have the biggest impact on your customer experience.
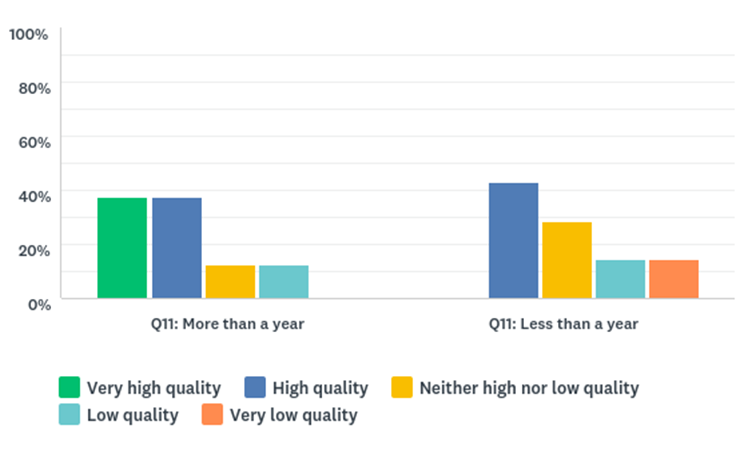
You can use compare rules to see how customers’ answers vary by factors like: the length of time they’ve worked with you, the industry they’re in, the way they use your product/service, etc. After applying any rules, you should see side-by-side comparisons of each group across every closed-ended question.
For example, if you compare customers who’ve worked with you more than a year with those who’ve worked with you less than a year, you can get the following chart from the question, “How would you rate the quality of our product?”
Look at your open-ended feedback
When customers tell you something in their own words, you’ll want to listen closely. Their feedback can help you figure out how to improve your product/service, identify pressing issues to address, and much more.
You can review each open-ended response individually, but to get a broad, easy-to-understand summary of what’s being said, use our word cloud feature. It shows you the key words/phrases used in your responses, where the relative size of each word or phrase indicates how often it’s used.
For example, say your organization sells sparkling water. The word cloud from your customers might look like this:

With only a quick glance, you can tell that most customers think your water is refreshing and bubbly—but also expensive and fancy.
It’s also a good idea to use Sentiment Analysis in addition to our Word Cloud. Sentiment Analysis is an AI-powered feature that uses machine learning to categorize open-ended responses as positive, neutral, or negative. It then shows you the sentiment breakdown of respondents by percentage.
This feature can help you understand how happy—or unhappy—your customers are, and it allows you to drill down on a particular sentiment to uncover the reasons behind their feelings.
Say you asked customers the open-ended question, “How would you describe the quality of our sparkling water?” With Sentiment Analysis, you can see something like the following:

Pro tip: Filter any question—or the entire survey—by a particular sentiment. You can then see how respondents who are categorized as positive, neutral, or negative answered other questions.
Track how your customer experience is changing over time
Understanding how your results are shifting over time and the reasons for their shifts is crucial to delivering valuable customer experiences.
It allows you to spot—and fix—issues quickly, and it helps you evaluate both your team’s and product’s performance over time. Also, by understanding how different areas of your business are trending, you can better allocate resources in ways that benefit your customers.
To see how the responses from any of your closed-ended questions are changing, visit the Data Trends tab in SurveyMonkey Analyze.
Share your customer experience data
Now that you’ve collected your responses and analyzed them carefully, it’s time to share them out with the wider team!
This involves:
- Giving everyone a high-level overview
- Sharing specific feedback with each team
- Sending responses to customer-facing colleagues
Let’s review each of these actions.
Give the team a high-level overview
When you review your data as a whole, you’ll likely come away with clear takeaways for what your organization does well at and what it can improve on.
It’s your job to inform the rest of your team what these takeaways are so that they can approach their work with the customer’s interests in mind.
Improve your team’s customer focus
Read our playbook to learn how you can improve your team’s connection to customers.
Before you share the survey data with your team, create customizable charts from each closed-ended question, and build word clouds from the open-ended questions. Then save the view.
You can then link to the view in company-wide emails and/or post it in a place any employee can access, like an internal Wiki. Wherever you end up sharing it, try to complement the view with a summary of the key results—in your own words—so that employees can more easily interpret the data.
Share results with different functions in your company
Customer experience data can have different implications for different teams.
It might help a product team determine the features they should prioritize next or the bugs they need to focus on fixing first. Meanwhile, it can help customer-facing teams understand how well-supported customers are, and pinpoint the biggest opportunities for improvement.
Help each team make meaningful conclusions, quickly, by sharing the most relevant data with them. Like the previous step, this means creating views. However, unlike the org-wide view, each department-specific view should include:
- The questions that are relevant to the department
- The filters and compare rules that each team cares about
Pro tip: Ask the people you’re sharing your results with how they want the data sliced and diced before you send a view their way. It’ll prevent back and forths and help them see the most relevant data, faster.
- Open-ended responses filtered by relevant tags—where, for example, the product team can get a view that’s filtered by the “product feedback” tag.
Note: To filter by tags, you first need to create the different tags you’d like to use, and then tag each open-ended response by the category it relates to.
Send responses to the appropriate customer-facing colleagues
Minimize the time it takes to respond to clients’ issues or requests by immediately giving customer-facing employees access to the responses.
You can tackle this in a number of ways:
- Integrate SurveyMonkey with your customer relationship management (CRM) tool. The responses can then populate in the contact page of your CRM tool, and automatically notify the owner of the account.
- Share response alerts with your customer-facing employees. This enables their team to immediately receive an email every time a response comes in.
- If your organization doesn’t have a lot of respondents, you can tag each response by the customer-facing employee who manages that contact. Then, filter by the appropriate customer-facing employee before you share a view of the results with them.
- Present responses the way you want with our Results Dashboard. Once you finish creating the dashboard view, you can easily share it via link.
- Using SurveyMonkey CX, you can automate the delivery of reports (that can be customized to meet the needs of different teams) on a daily, weekly, monthly, or quarterly basis.
Improving the customer experience requires setting up a comprehensive system for measuring, analyzing, and sharing your responses over time. Once you nail each of these steps, your customers—and your organization—will be in a position to succeed.
Want more guidance on running a top-notch customer feedback program? Need ready-to-use NPS survey templates? Our customer feedback guide has everything you need to be successful!
See how SurveyMonkey can power your curiosity
리소스 더 살펴보기

역할에 맞는 솔루션
SurveyMonkey로 업무 효율성을 높일 수 있습니다. 성공적인 전략, 제품, 경험 등으로 더 큰 효과를 거둘 수 있는 방법을 알아보세요.

CSAT 계산기: 고객 만족도 측정 및 해석
고객 기대를 충족하고 있으신가요? SurveyMonkey의 무료 CSAT 계산기를 사용해 고객 만족도 점수를 평가하고 수익 성장을 이끌어 보세요.

Hornblower, 전 세계 고객 경험 향상
Hornblower가 어떻게 SurveyMonkey와 강력한 AI를 활용해 NPS 데이터를 최대한 활용하고, 고객 인사이트를 수집하며, 고객 경험을 개선하는지 확인해보세요.

Ryanair가 어떻게 대규모 고객 인사이트를 수집하는지 알아보세요
Ryanair가 SurveyMonkey와 Microsoft Power BI 연동 서비스를 사용하여 어떻게 월 50만 개의 CSAT 설문조사 응답을 추적하고 고객 경험을 개선하는지 알아보세요.